Price Elasticity of Demand Calculator (Midpoint Method)
Enter the old and new price and the quantity sold at each to get the elasticity of demand, whether it is elastic or inelastic, and the change in revenue.
This price elasticity of demand calculator measures how much the quantity you sell changes when you change the price. You enter the old and new price and the quantity sold at each, and it returns the elasticity, says whether demand is elastic or inelastic, and shows the revenue before and after. It uses the midpoint method by default, and a simple percentage method is one click away. It runs in your browser with no sign-up, and nothing you type is uploaded.
The number matters for pricing. If demand is inelastic, a price rise brings in more revenue even though you sell a little less. If demand is elastic, the same rise cuts revenue, because customers leave faster than the price goes up. Use real sales at two different prices, not a guess.
How to use the Price Elasticity of Demand Calculator
- Type the Old price and the New price, per unit. They must be different, or there is no price change to measure.
- Type the Old quantity demanded and the New quantity demanded: the units sold, or demanded, at each price in the same length of time.
- Under Method, keep Midpoint (arc) method, or choose Simple percentage change from the old values.
- Optionally, under More options, set the Currency shown for the revenue.
- Read the Price elasticity of demand, Demand is, the changes in quantity and price, and the revenue at the old and new price. How it was calculated gives each step, and any warning appears above it. If the elasticity looks wrong, check that the two quantities are for periods of the same length and that nothing but the price changed. Start with a pair of figures you know the answer to, such as an example button, to see how the page reads.
The four example buttons at the top of the form fill in a realistic case, and Reset restores the starting example. Below the result, Copy result copies the figures, Copy link keeps all your inputs in the page address so the same result reopens later, and Print / save as PDF prints the inputs, result, steps and date.
What is the price elasticity of demand formula?
Price elasticity of demand is the percentage change in quantity demanded divided by the percentage change in price. The midpoint method measures each percentage change against the average of the old and new value, which gives the same answer whichever way you move the price:
% change in quantity = (Q2 − Q1) ÷ ((Q1 + Q2) ÷ 2)
% change in price = (P2 − P1) ÷ ((P1 + P2) ÷ 2)
Elasticity = % change in quantity ÷ % change in price
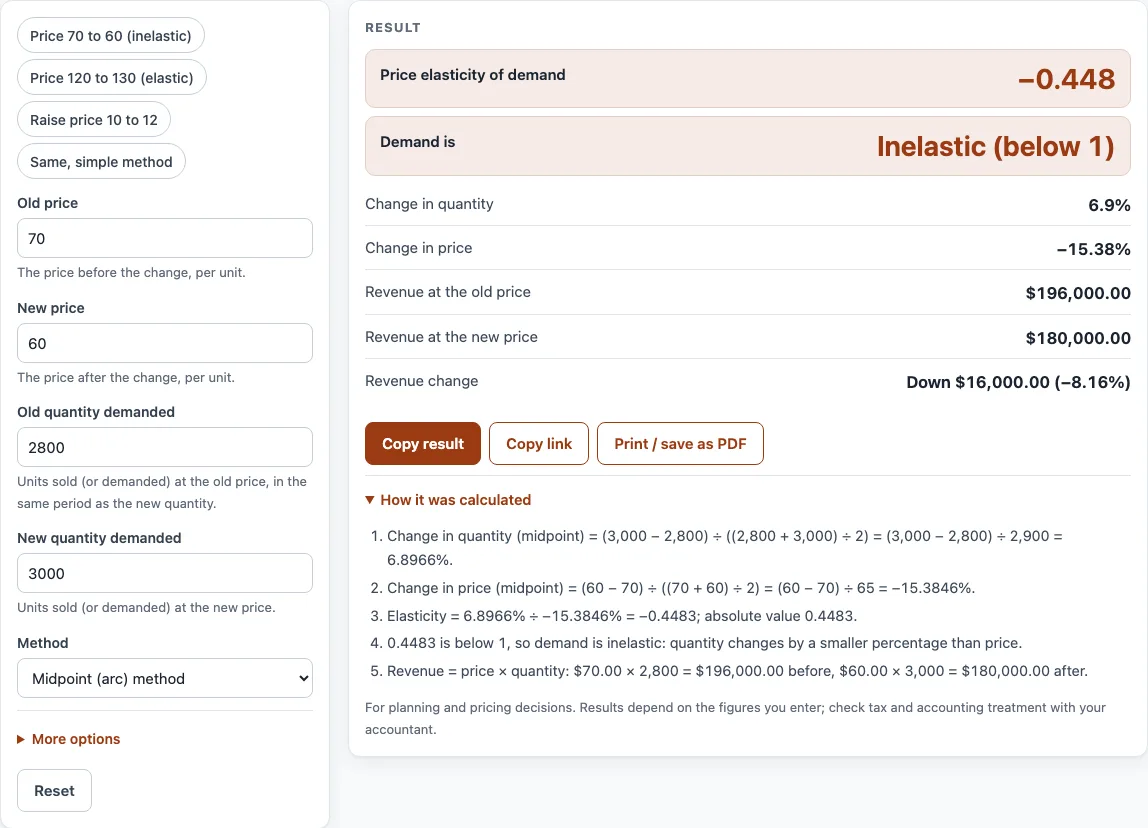
OpenStax’s economics textbook works an example. The price falls from 70 to 60 while the quantity rises from 2,800 to 3,000. The change in quantity is 200 ÷ 2,900 = 6.9%, and the change in price is −10 ÷ 65 = −15.4%. The elasticity is 6.9% ÷ −15.4% = −0.45. Elasticity of demand is normally negative because price and quantity move in opposite directions, so it is usually quoted as an absolute value, 0.45 here.
Is demand elastic or inelastic?
If the absolute value is above 1, demand is elastic: quantity changes by a larger percentage than the price. If it is below 1, demand is inelastic: quantity changes by a smaller percentage. If it is exactly 1, demand is unit elastic. In the OpenStax example the price rises from 120 to 130 while the quantity falls from 1,800 to 1,600. The elasticity is −11.76% ÷ 8% = −1.47, so demand is elastic.
What does elasticity mean for revenue?
Revenue is price times quantity. When demand is elastic, a price rise lowers revenue and a price cut raises it. When demand is inelastic, a price rise raises revenue and a price cut lowers it. With unit elasticity, revenue stays the same.
The calculator checks this against your own figures. In the 120 to 130 example, revenue falls from 120 × 1,800 = 216,000 to 130 × 1,600 = 208,000, as an elastic result predicts. In the 70 to 60 example, the price falls and demand is inelastic, so revenue falls too, from 196,000 to 180,000. Revenue is not profit: a higher price can also raise your margin, so compare your costs as well.
How does the simple method differ from the midpoint method?
The simple method measures each change against the old value only. With a price of 10 raised to 12 and a quantity of 100 falling to 80, the simple method gives −20% ÷ 20% = −1.00, unit elastic. The midpoint method gives −22.2% ÷ 18.2% = −1.22, elastic. The two differ because 80 is 20% below 100, while 100 is 25% above 80. The midpoint method removes that difference, which is why textbooks use it. Use the simple method when your course or report asks for percentage change from the starting point.
Sources
- OpenStax, Principles of Economics 3e, section 5.1: Price elasticity of demand and price elasticity of supply (checked October 2026) — the midpoint formula and the two worked examples, 70 to 60 and 120 to 130.
- OpenStax, Principles of Economics 3e, section 5.3: Elasticity and pricing (checked October 2026) — how elastic, inelastic and unit elastic demand affect total revenue when the price changes.
- Every formula is worked through by hand in the tool’s tests (at least five reference cases).
Worked examples
| Input | Result |
|---|---|
| price $70.00 to $60.00, quantity 2,800 to 3,000 | elasticity −0.448, demand is inelastic (below 1) |
| price $120.00 to $130.00, quantity 1,800 to 1,600 | elasticity −1.471, demand is elastic (above 1) |
| price $10.00 to $12.00, quantity 100 to 80 | elasticity −1, demand is unit elastic (exactly 1) |
| price $10.00 to $12.00, quantity 100 to 80 | elasticity −1.222, demand is elastic (above 1) |
| price €4.00 to €5.00, quantity 500 to 500 | elasticity 0, demand is perfectly inelastic (quantity did not change) |
Calculated by the tool above with these values.
Frequently asked questions
Why is the elasticity negative?
Demand curves slope down: when the price goes up, the quantity goes down. The two percentage changes have opposite signs, so the ratio is negative. People usually quote the absolute value. This calculator shows both.
What if the elasticity comes out positive?
Quantity moved in the same direction as the price. A demand curve normally slopes down, so something else probably changed as well, such as income, a promotion or the season. The calculator warns you. Check that you compared two periods that differ only in price.
How do I get the two quantities?
Use real sales at each price, for periods of the same length. Give the new price time to settle before you read the quantity, and avoid periods with a holiday or a sale unless it applies to both.
Is elasticity the same at every price?
No. It changes along a demand curve. The calculator gives the elasticity between your two points, which is why it is sometimes called arc elasticity.
Can I use it for several products?
It handles one pair of prices and quantities at a time. Run it once per product, or once for each price test, and compare the results.
Is my information sent to a server?
No. Everything runs in your browser and nothing you type is uploaded. Nothing is stored on a server.
Related tools
- Price increase calculator — percent increase and the new price that keeps your margin.
- Markup calculator — price from cost and markup, or the markup between cost and price.
- Discount calculator — percent off, sale price and stacked trade discounts.
- Break even calculator — break-even units and sales with a chart.
- Contribution margin calculator — contribution per unit, in total and as a ratio.
- Profit margin calculator — profit, margin and markup from cost and price, or the price for a target margin.